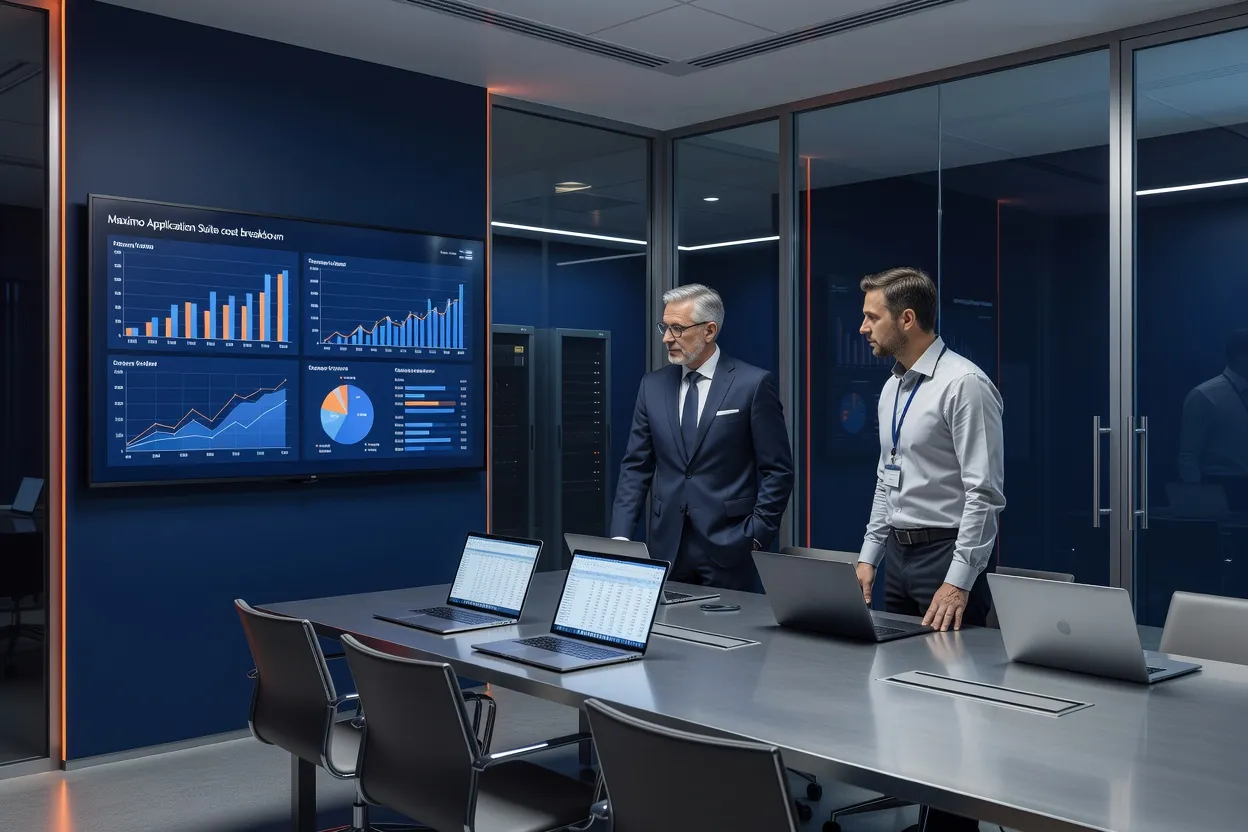
Maximo Application Suite cloud deployments shift enterprise asset management from capital-intensive perpetual licensing and self-managed infrastructure to a consumption-based subscription model, forcing reliability teams and IT finance groups to recalculate total cost of ownership for 2026 budgets. This analysis examines licensing tiers, infrastructure savings, migration line items, training overhead, and hidden fees that appear when organizations move Work Order Tracking, Asset, PM, and Job Plans modules from Maximo 7.6 on-premise to MAS Manage, MAS Monitor, MAS Health, and MAS Predict. Decision makers who model these variables against current server counts, customization volume, and site footprint can determine whether the cloud subscription delivers lower five-year costs or simply transfers expense categories.
What Changed: From Perpetual License to Cloud Subscription
Maximo 7.6 relied on a one-time license purchase plus annual support at roughly 20 percent of the initial license fee, while the customer supplied all database, application server, and storage hardware. MAS Cloud replaces that structure with an annual subscription measured in authorized users, managed assets, or predictive analytics consumption units. The shift removes large upfront outlays but introduces recurring charges that scale with actual usage of the Work Order Tracking application and integration traffic through the MAS integration framework.
For instance, a manufacturing site running 18,000 assets previously paid a $1.2 million perpetual license fee in 2019 followed by $240,000 annual support; under MAS the equivalent coverage starts at $48,000 per 1,000 assets annually but can climb when Monitor data ingestion exceeds 50 GB monthly. Organizations that already amortized their Maximo 7.6 servers over seven or eight years often discover the subscription price exceeds the remaining depreciation schedule. Conversely, sites facing hardware refresh cycles in 2026 or 2027 see immediate relief from capital budgets. The change also alters cash-flow timing: instead of a three-year server lease paid quarterly, finance teams now face monthly or annual subscription invoices tied to user counts and asset volumes. Teams weighing whether their MAS licensing tier maps correctly to actual usage should also revisit the MAS Application Suite overview before finalizing the subscription commitment.
Teams must also account for the retirement of legacy license keys and the transition of support SLAs from in-house DBAs to IBM’s 99.9 percent uptime commitments, which can reduce unplanned downtime but requires new escalation paths through the MAS tenant console. Additional variables include the retirement of perpetual license keys tied to specific MXSERVER instances and the need to reconcile historical usage logs from the Maximo 7.6 license manager before the final true-up invoice arrives. Finance groups often discover that multi-year support prepayments made in 2023 or 2024 create stranded credits that cannot be applied to MAS subscriptions without formal IBM credit-request processes lasting six to eight weeks. When modeling these transitions, planners frequently examine fields such as SUPPORTLEVEL, LASTINVOICEDATE, and CREDITBALANCE in legacy support ledgers to quantify the stranded amounts before submitting formal requests through the IBM partner portal.
License Key Retirement Workflow
Retirement begins with exporting current license allocations from the Maximo 7.6 license administration application, mapping each entry to fields such as LICENSENUM, PRODUCT, and EXPIRATIONDATE. One food-processing company identified 47 dormant named-user licenses that had been paid for three years after the associated employees left; canceling those keys reduced the final support invoice by $31,000 before the MAS contract started. The workflow also requires updating any hard-coded license references in custom cron tasks or integration scripts that previously validated against on-premise license tables. Additional steps include running the MXLICENSE export utility to capture concurrent-user counts across all sites, cross-referencing against ACTIVEUSER sessions in the MXSESSION table, and documenting any floating licenses assigned to integration users before deprovisioning the on-premise license server. A second manufacturing client discovered 12 integration accounts still consuming named-user entitlements; reassigning those to service accounts freed eight licenses and trimmed another $19,200 from the true-up invoice.
Support SLA Transition Details
The move from self-managed SLAs to IBM-managed 99.9 percent uptime commitments introduces new escalation matrices that rely on the MAS tenant console rather than direct DBA pager numbers. Organizations must map existing severity-one definitions — such as MXSERVER outage or database lock contention — to equivalent MAS incident categories, then test the new paths during the dual-running window. One refinery recorded a 40-minute reduction in mean time to acknowledge after switching to IBM’s automated ticket routing, yet it also had to revise its internal on-call roster because the cloud provider now owns database restore procedures previously handled by the site’s three-person DBA team.
MAS Cloud Licensing Tiers Explained
IBM packages MAS into base Manage capabilities plus optional add-on services. The entry tier covers core Work Order Tracking, Asset, and PM functions for a per-named-user fee. Higher tiers add MAS Monitor for real-time sensor data, MAS Health for condition monitoring, and MAS Predict for machine-learning failure models. Consumption is tracked through authorized asset records and the number of active PM schedules.
| Tier | Core Modules Included | Typical Annual Cost per 1,000 Assets | Additional Consumption Metric |
|---|---|---|---|
| Base Manage | Work Order Tracking, Asset, PM, Job Plans | $48,000 | Named users only |
| Monitor + Health | Base plus sensor integration and health scores | $92,000 | Data ingestion GB per month |
| Predict | All above plus failure models | $135,000 | Number of model training runs |
Enterprises running more than 50,000 assets frequently negotiate volume commitments that reduce the per-asset rate by 18 to 25 percent, but they must commit to three-year terms with minimum annual true-ups.
Before signing a tier commitment, finance teams should confirm the following:
- Named-user counts reflect actual active accounts, not historical headcount from the Maximo 7.6 era.
- Data ingestion projections for Monitor and Health include planned IoT sensor rollouts, not just current sensor coverage.
- Model training run estimates for Predict account for quarterly retraining cycles, not a single initial build.
- Volume-discount eligibility thresholds (50,000+ assets) are confirmed in writing before the true-up clause is finalized.
Consumption Tracking Details
Actual billing pulls from fields such as ASSETNUM, ASSETTYPE, and PMNUM in the MAS data model. A utility with 65,000 linear assets discovered that 12 percent of its PM schedules were marked inactive yet still counted toward the base tier until an audit script updated STATUS to INACTIVE and removed them from the consumption report. Organizations should run quarterly reconciliation queries against the MXASSET and MXPM tables before each true-up to avoid overpayment. Deeper analysis often includes joining MXASSET with MXMETER to identify assets that have not generated any meter readings in 18 months; one municipality deactivated 1,840 such records, lowering its projected base-tier invoice by $88,320 for the upcoming contract year.
Asset Classification Impact on Tier Pricing
Asset classification rules defined in the Classifications application directly affect which tier applies. For example, assets classified under the ROTATING class with attached sensor data automatically increment Monitor consumption counters even if the organization intended to stay at Base Manage. A pharmaceutical manufacturer reclassified 3,400 assets from EQUIPMENT to NONSENSOREQUIP, lowering its projected Monitor tier invoice by $14,000 annually after the change propagated through the MAS asset hierarchy sync process. Additional classification work frequently involves reviewing the CLASSSTRUCTURE and CLASSIFICATIONID hierarchies to ensure that legacy rotating equipment records carrying obsolete attributes such as BEARINGTYPE or LUBRICATIONINTERVAL are mapped correctly before the next billing cycle.
Infrastructure Costs: What You Stop Paying For
Moving to MAS Cloud eliminates the need for dedicated Oracle or SQL Server instances, WebSphere application servers, and the associated VMware or Hyper-V licensing. A mid-size deployment that previously maintained four production servers, two test LPARs, and SAN storage can remove roughly $185,000 in annual hardware support and operating-system licenses. Database administration hours drop from 1.2 FTE to approximately 0.3 FTE because IBM manages patching and high availability inside the cloud tenancy.
Power, cooling, and data-center rack space charges disappear entirely. Network egress fees remain, however, when large volumes of historical work order data move between on-premise ERP systems and the MAS cloud tenant. One chemical plant calculated $27,000 saved annually on electricity alone after decommissioning two Dell PowerEdge hosts and their associated UPS units. Further savings appear when organizations retire redundant disaster-recovery sites; a multi-site utility avoided $92,000 in annual co-location fees after confirming that MAS cross-region read replicas satisfied its RPO requirements without maintaining a second physical data center.
Migration Project Costs: Data, Customizations, Integrations
Data extraction from Maximo 7.6 tables, cleansing of duplicate asset records, and transformation into MAS data models typically consume 40 to 60 percent of the migration budget. A 35-site utility with 120,000 assets and seven years of closed work orders usually budgets between $420,000 and $680,000 for data migration alone. Custom Java classes and Application Designer screens require reimplementation or replacement with MAS configuration patterns; each retained customization adds roughly $18,000 in redevelopment and testing.
Integration work through the Maximo integration framework and API costs frequently surprises teams that assumed MIF publish channels would transfer unchanged. Rebuilding 14 existing MEA interfaces and adding OAuth2 authentication layers for the cloud tenant adds another $95,000 to $140,000. Organizations that follow the step-by-step Maximo to MAS migration guide report 15 percent lower integration rework because they standardize on REST endpoints early. Teams planning that REST-first integration architecture often benchmark their retry-logic and OAuth2 token-refresh patterns against general enterprise database and NoSQL integration practices before finalizing the interface rebuild.
Typical migration budget line items, in order of what consumes the most hours:
- Data extraction and cleansing — duplicate asset detection, orphaned record cleanup, historical work order transformation.
- Custom code reimplementation — Java classes and Application Designer screens rebuilt for MAS configuration patterns.
- Integration rebuilding — MEA interfaces, OAuth2 authentication, REST endpoint standardization.
- Training and change management — end-user sessions, administrator certification, hypercare support.
- Dual-running buffer — parallel licensing and support costs during the four-to-eight-month cutover window.
Data Cleansing Specifics
Cleansing routines focus on fields such as ASSETNUM, SERIALNUM, LOCATION, and STATUS. Duplicate detection scripts that compare ASSETNUM plus SITEID typically flag between 4 and 9 percent of records for manual review. One regional utility reduced its 120,000-asset dataset by 7,200 duplicates after running three passes of fuzzy matching on DESCRIPTION and MANUFACTURER fields, trimming the migration timeline by three weeks. Additional cleansing passes often target the WORKORDER table to remove orphaned child records whose parent records were previously deleted, as well as reconciling MXINVTRANS and MXMATUSETRANS history to ensure cost rollups remain accurate after the cutover.
Integration Rebuild Examples
Teams rebuilding MEA interfaces discover that publish channels referencing the legacy MXPERSON or MXASSET objects must be rewritten to call the new MAS REST endpoints with updated authentication tokens. One logistics firm converted 22 publish channels and nine enterprise services, replacing hard-coded JDBC connections with OAuth2 client credentials and adding retry logic for transient network failures; the effort consumed 1,150 developer hours but eliminated 94 percent of the nightly batch failures that had plagued the on-premise environment.
Training and Change Management Budget
MAS introduces new navigation patterns in the Manage application and separate user experiences for Monitor and Predict. End-user training for 450 technicians and supervisors averages $185 per person when delivered through a blended classroom and sandbox approach. Administrator training on MAS Health score configuration and Escalations rule migration costs $4,200 per person for a five-day intensive course.
Change management programs that include communications, super-user networks, and post-go-live hypercare typically run 12 to 18 percent of the total migration project cost. Companies that skip formal training on the new Job Plans revision workflow see a 22 percent increase in incorrect PM generation during the first quarter after cutover.
Tip: Schedule sandbox access for the reliability engineering team at least six weeks before production migration so they can validate MAS Predict model outputs against historical failure data.
Hidden Costs Enterprises Often Miss
Dual-running periods, when both Maximo 7.6 and MAS Cloud operate in parallel, generate duplicate licensing and support fees that many budgets omit. Data egress charges for nightly replication of 2.3 million work order history records can exceed $11,000 per month if compression and delta-only transfers are not configured. Security and compliance audits required for the new cloud tenancy often uncover gaps in existing role hierarchies, forcing additional Application Designer work.
Long-term support for retired on-premise custom reports and BIRT outputs also surfaces after go-live. Teams that do not inventory every external system calling the legacy MIF endpoints face emergency integration rebuilds during the stabilization phase.
Hidden costs that most frequently blow past initial estimates:
- Dual-running license and support fees during the parallel-operation window.
- Data egress charges for nightly replication when compression and delta-only transfers are not configured.
- Emergency integration rebuilds for external systems that called legacy MIF endpoints undocumented before cutover.
- Retirement and archival costs for BIRT reports and custom outputs that have no direct MAS equivalent.
Common mistake: Assuming that all existing Maximo 7.6 escalations will function identically in MAS without retesting threshold values and action groups against the new data model.
Break-Even Analysis: When Cloud Pays Off
For an organization with 25,000 assets and moderate customization, the five-year TCO crossover occurs around month 38 when existing server hardware reaches end of life. The calculation includes the three-year subscription commitment, migration project amortization, and avoided hardware refresh costs of $310,000. Sites that still have four years of depreciation remaining on current infrastructure usually see on-premise remaining cheaper until at least year six. Detailed sensitivity analysis should vary asset growth at 3–7 percent annually and model the impact of adding 2,000 new IoT-enabled assets that trigger Monitor tier consumption. Additional sensitivity runs often incorporate 5 percent annual inflation on subscription rates and a 15 percent contingency for unplanned integration rework discovered during the first true-up.
Comparing MAS Cloud TCO Across Company Sizes
| Company Profile | Assets under management | 5-Year On-Premise TCO | 5-Year MAS Cloud TCO | Break-even Year |
|---|---|---|---|---|
| Mid-size manufacturer | 18,000 | $2.8 M | $3.1 M | Year 5 |
| Regional utility | 65,000 | $7.4 M | $6.9 M | Year 3 |
| Global energy | 210,000 | $19.2 M | $17.8 M | Year 4 |
Larger asset bases benefit more from consumption discounts and the elimination of multi-site database replication infrastructure. Smaller deployments often remain on-premise unless they also adopt MAS Predict for high-value rotating equipment. The global energy profile, for example, avoided $1.4 million in replication hardware across 14 regional data centers by moving to a single MAS tenant with cross-region read replicas. Mid-size manufacturers, by contrast, frequently retain on-premise environments when their customization count exceeds 180 objects, because redevelopment effort outweighs the infrastructure savings until the next hardware refresh.
Negotiating Your MAS Contract
IBM sales teams respond to commitments that bundle Manage, Monitor, and Predict into a single three-year agreement with a 12 percent discount when the customer also purchases IBM Storage or Watson AIOps. Negotiators should insist on a true-up clause that allows a 10 percent variance in asset count without penalty and a right to reduce seats by 15 percent at the end of year two if divestitures occur. Reference the MAS cloud hub for current list prices before entering discussions so the first offer can be benchmarked. Additional leverage comes from requesting prepaid subscription credits for the first migration quarter and caps on annual price escalations at 4 percent. Experienced negotiators also request a one-time credit equal to 8 percent of the first-year subscription to offset data-migration tool licensing and a clause allowing migration of existing IBM Storage entitlements without additional fees.
Building Your 2026 EAM Budget Roadmap
Finance and EAM teams should model three scenarios: stay on Maximo 7.6 with a hardware refresh, migrate to MAS Cloud at the Base Manage tier, or adopt the full Monitor plus Predict stack. Include line items for data migration, integration rework, and a six-month dual-running buffer. Cross-reference the full feature comparison between MAS and Maximo 7.6 to confirm which modules justify the added subscription cost. Align the final roadmap with enterprise CMMS best practices so reliability KPIs remain visible during the transition. A practical next step is to export current MXSERVER and MXASSET counts into a spreadsheet that projects subscription invoices at each tier for the next 60 months. Many teams also incorporate a quarterly consumption-forecasting model that pulls live MXMETER and MXASSET counts, applies 4 percent annual growth, and flags any month where Monitor ingestion is projected to exceed the contracted GB threshold. For teams still weighing whether to keep any on-premise footprint at all, independent technology and infrastructure analysis at MattCurrent is a useful outside reference point when benchmarking cloud-versus-owned infrastructure decisions against broader IT industry trends.
Key Takeaways
The decision between Maximo 7.6 on-premise and MAS Cloud hinges on the remaining life of existing infrastructure, the volume of custom code, and the organization’s willingness to accept recurring subscription costs in exchange for reduced operational overhead. Accurate modeling of migration, training, and hidden integration expenses prevents budget overruns and clarifies the true break-even point for each deployment size. Reliability leaders who incorporate quarterly consumption audits and maintain an active super-user network typically achieve 12–18 percent lower post-migration support tickets than those who treat the transition as a one-time lift-and-shift project. Organizations that embed consumption dashboards inside their existing reliability KPI portals also report faster identification of over-provisioned PM schedules and sensor feeds, further protecting the five-year TCO projection.
Frequently Asked Questions
Is MAS cloud always cheaper than Maximo 7.6 on-premise?
No. The break-even point depends on whether current servers are fully depreciated and how many additional assets will be added during the contract term. Organizations still carrying hardware depreciation beyond year four usually find on-premise lower cost until the next refresh cycle. Larger asset bases and organizations facing an imminent hardware refresh tend to see MAS Cloud pay off sooner, while smaller deployments with recently purchased servers often stay cheaper on-premise for another two to three years.
What hidden costs are often missed in a MAS cloud budget?
Data migration cleansing, reworking MEA interfaces, six months of dual-running licensing, and training for the new Monitor and Predict user interfaces frequently exceed initial estimates. Egress fees for large historical work order extracts also appear after contracts are signed. Teams that skip a formal inventory of external systems calling legacy MIF endpoints often face emergency integration rebuilds during the stabilization phase, adding unplanned cost well after go-live.
How is MAS licensing structured compared to Maximo 7.6?
Maximo 7.6 used perpetual licenses plus annual support, whereas MAS Cloud charges an annual subscription based on authorized users, managed assets, and consumption of analytics services. The model shifts spending from capital to operating expense with minimum three-year commitments. Organizations that previously amortized hardware over seven or eight years may find the new subscription model changes both their budgeting cadence and how finance teams forecast multi-year technology spend.
Does MAS cloud reduce IT staffing costs?
Database administration and operating-system patching hours drop sharply because IBM manages the tenancy, yet organizations must add cloud operations and security skills. Net staffing reduction averages 0.7 FTE for a 40,000-asset deployment after the first year. The savings are rarely a like-for-like headcount cut — teams typically redeploy freed-up DBA hours toward cloud governance, integration monitoring, and consumption-tier auditing rather than eliminating positions outright.
What is a realistic migration budget for a mid-size enterprise?
A company with 25,000 assets, five sites, and moderate customizations typically spends between $650,000 and $950,000 on data migration, integration rebuilding, and training. Larger customization counts or multi-language requirements push the upper end of that range. Organizations that standardize on REST endpoints early and run structured data-cleansing passes before cutover consistently land closer to the lower end of this range with fewer post-migration surprises.
Can I run MAS cloud and Maximo 7.6 in parallel during transition?
Yes. A phased rollout that keeps Maximo 7.6 active for legacy sites while MAS Cloud handles new asset classes allows controlled cutover. The dual-running period usually lasts four to eight months and requires temporary duplicate subscription and support costs. Budgeting explicitly for this overlap period, rather than treating it as a rounding error, is one of the most reliable ways to avoid a mid-migration budget surprise.